Color Meanings Across Cultures
The Visualization
This is a project I did for a visualization class at UC Berkeley. The project tells the story of how colors have different meanings depending on what culture you see it used in. Blue can mean wealth in one culture and defeat in another.
I used D3 to build dendrograms and a line chart. I saved the dendrogram SVGs so I could refine them using Adobe Illustrator which I then used to build out the final visualiation. The interactive visualization can be seen here.
The Data
The data comes from the Information is Beautiful site(https://informationisbeautiful.net). They take pride in presenting 'juicy data' and have their own visualizations based on them.
The specific data used for this visualization can be found as a Google Sheet located here
Colors by Meanings
The first dendrogram at the top of the page shows meanings along the outside of the wheel with colors associated with those meanings as you move to the inside of the wheel.
Each of the colors shown are labeled with its respective, representative culture.

Colors by Culture
The second set of dendrograms represent colors based on culture. A drop-down menu allows viewers to select a culture that they wish to see.
The data gathered shows more results for certain cultures over others, so the resulting dendrogram may appear sparse for some cultures.

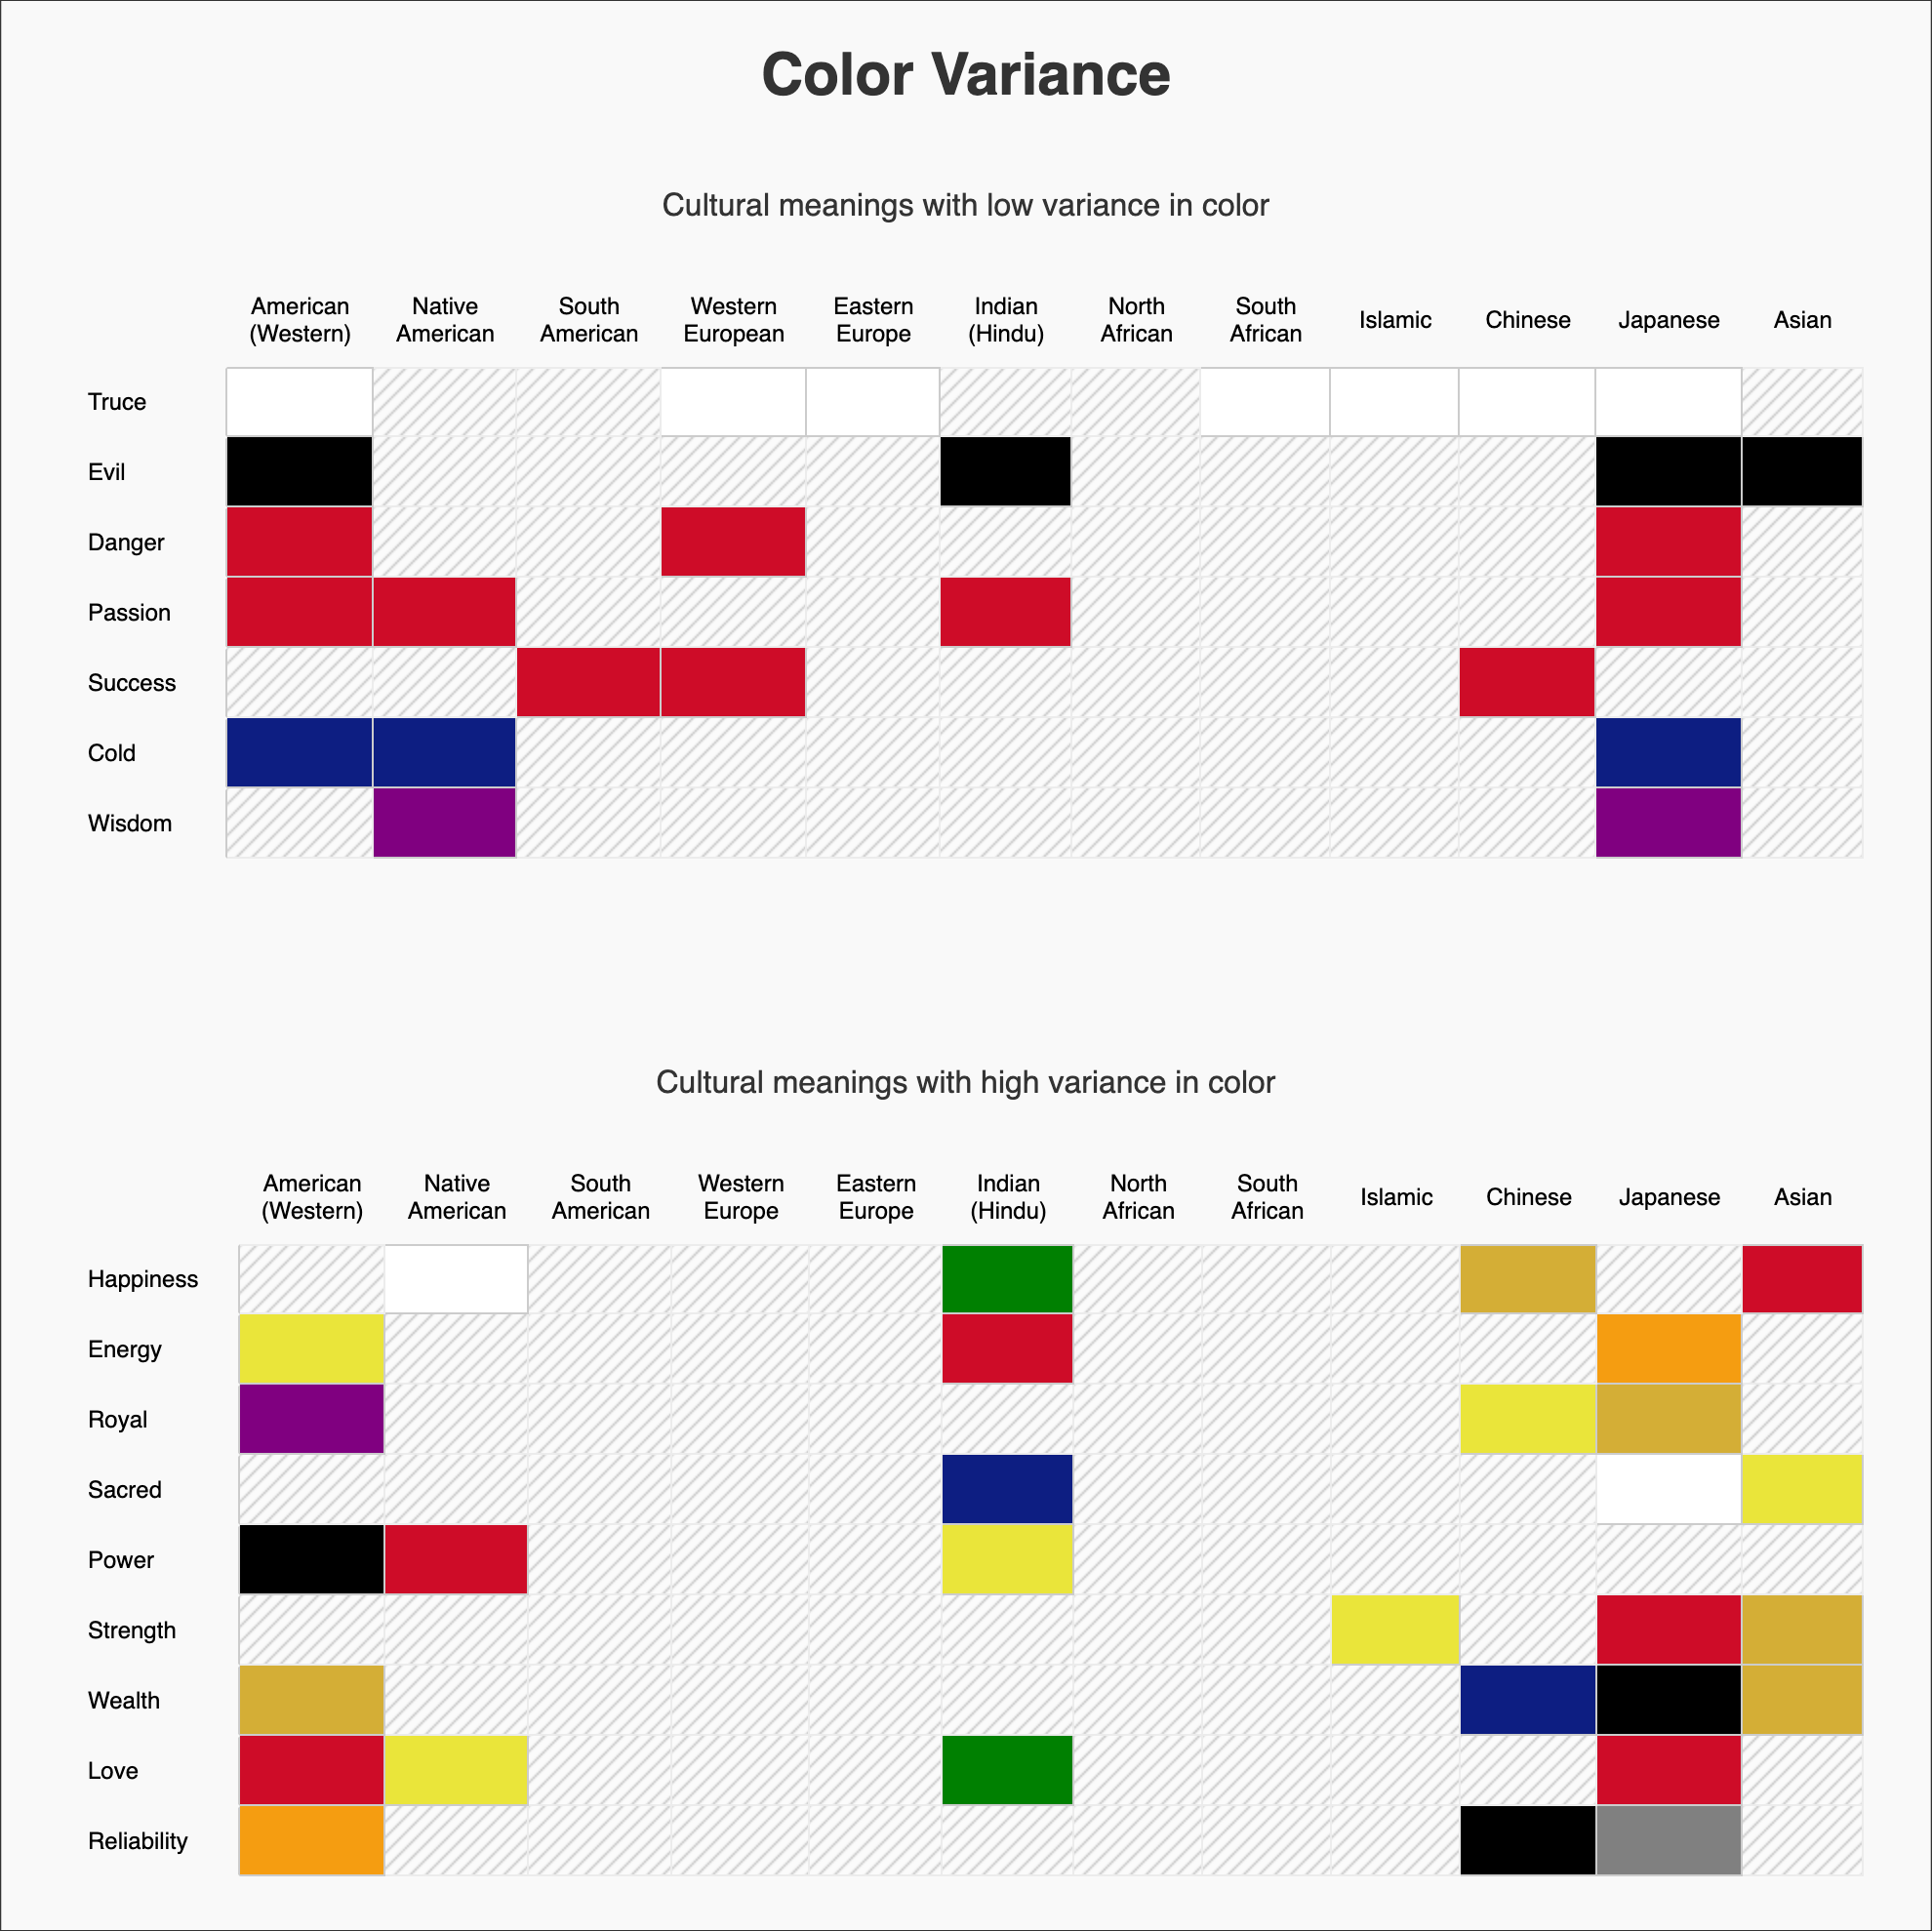
Color Variance
I thought it would be an interesting part of the story to show color variance across the cultural spectrum. Some meanings have similar colors regardless of culture, whereas other meanings(e.g. wealth), may have a wider variance in representative colors across cultures.
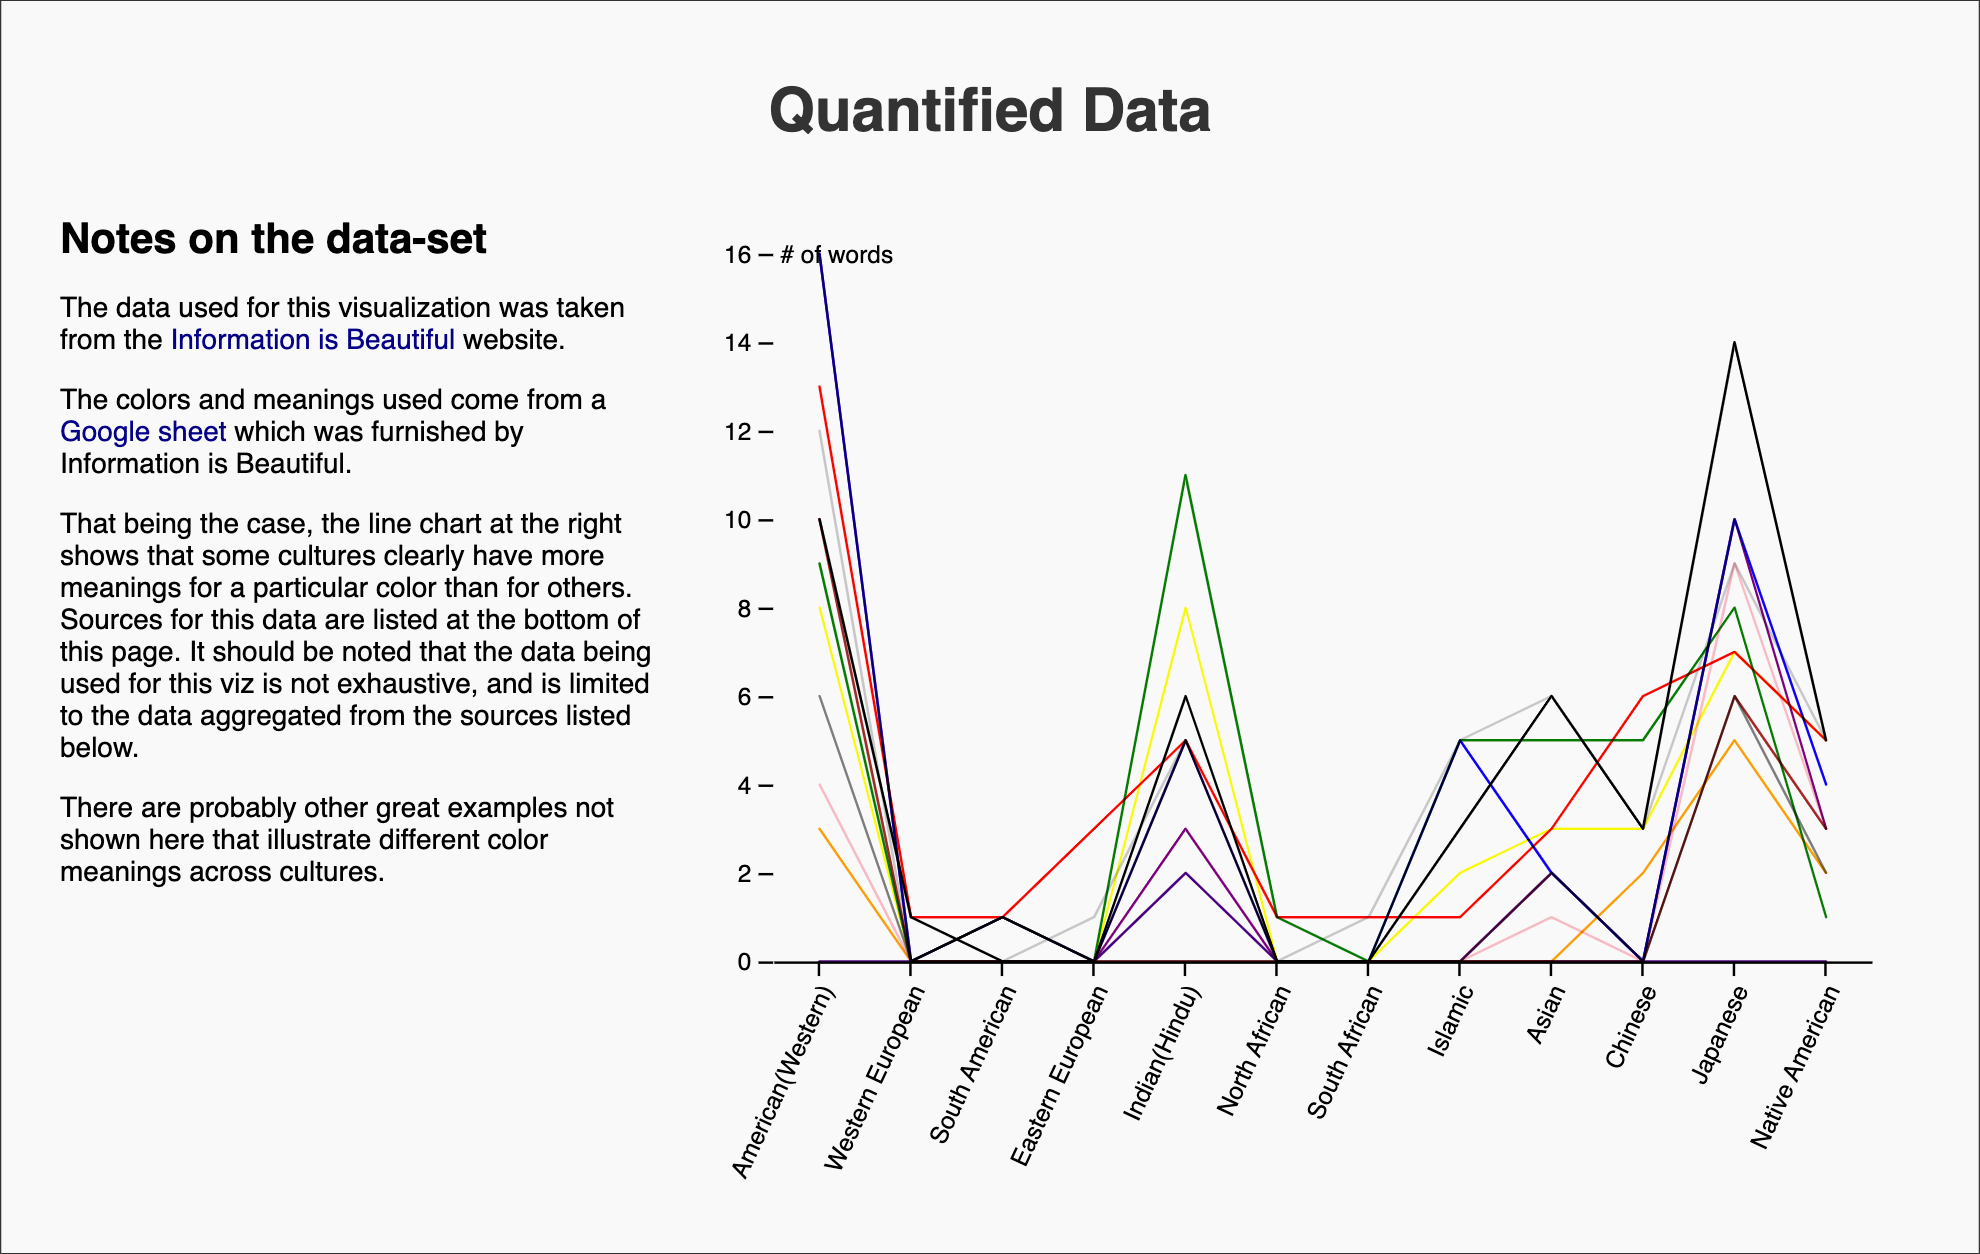
Data Limitations
As I mentioned about the dendrograms above, there tended to be more data available for some cultures over others. That being the case, I included a line graph showing how many words were described per culture.