Tools of the Trade
This visualization uses a Calderesque mobile to show likeability and usage frequency of popular data visualization tools. It was done as a challenge from the Data Visualization Society and won first place for exploratory visualizations.
The mobile is hierarchical and uses hanging ornaments on a sliding scale to show measurement (likeability and frequency).
The interactive visualization can be viewed here.
Tool Popularity and Likeability
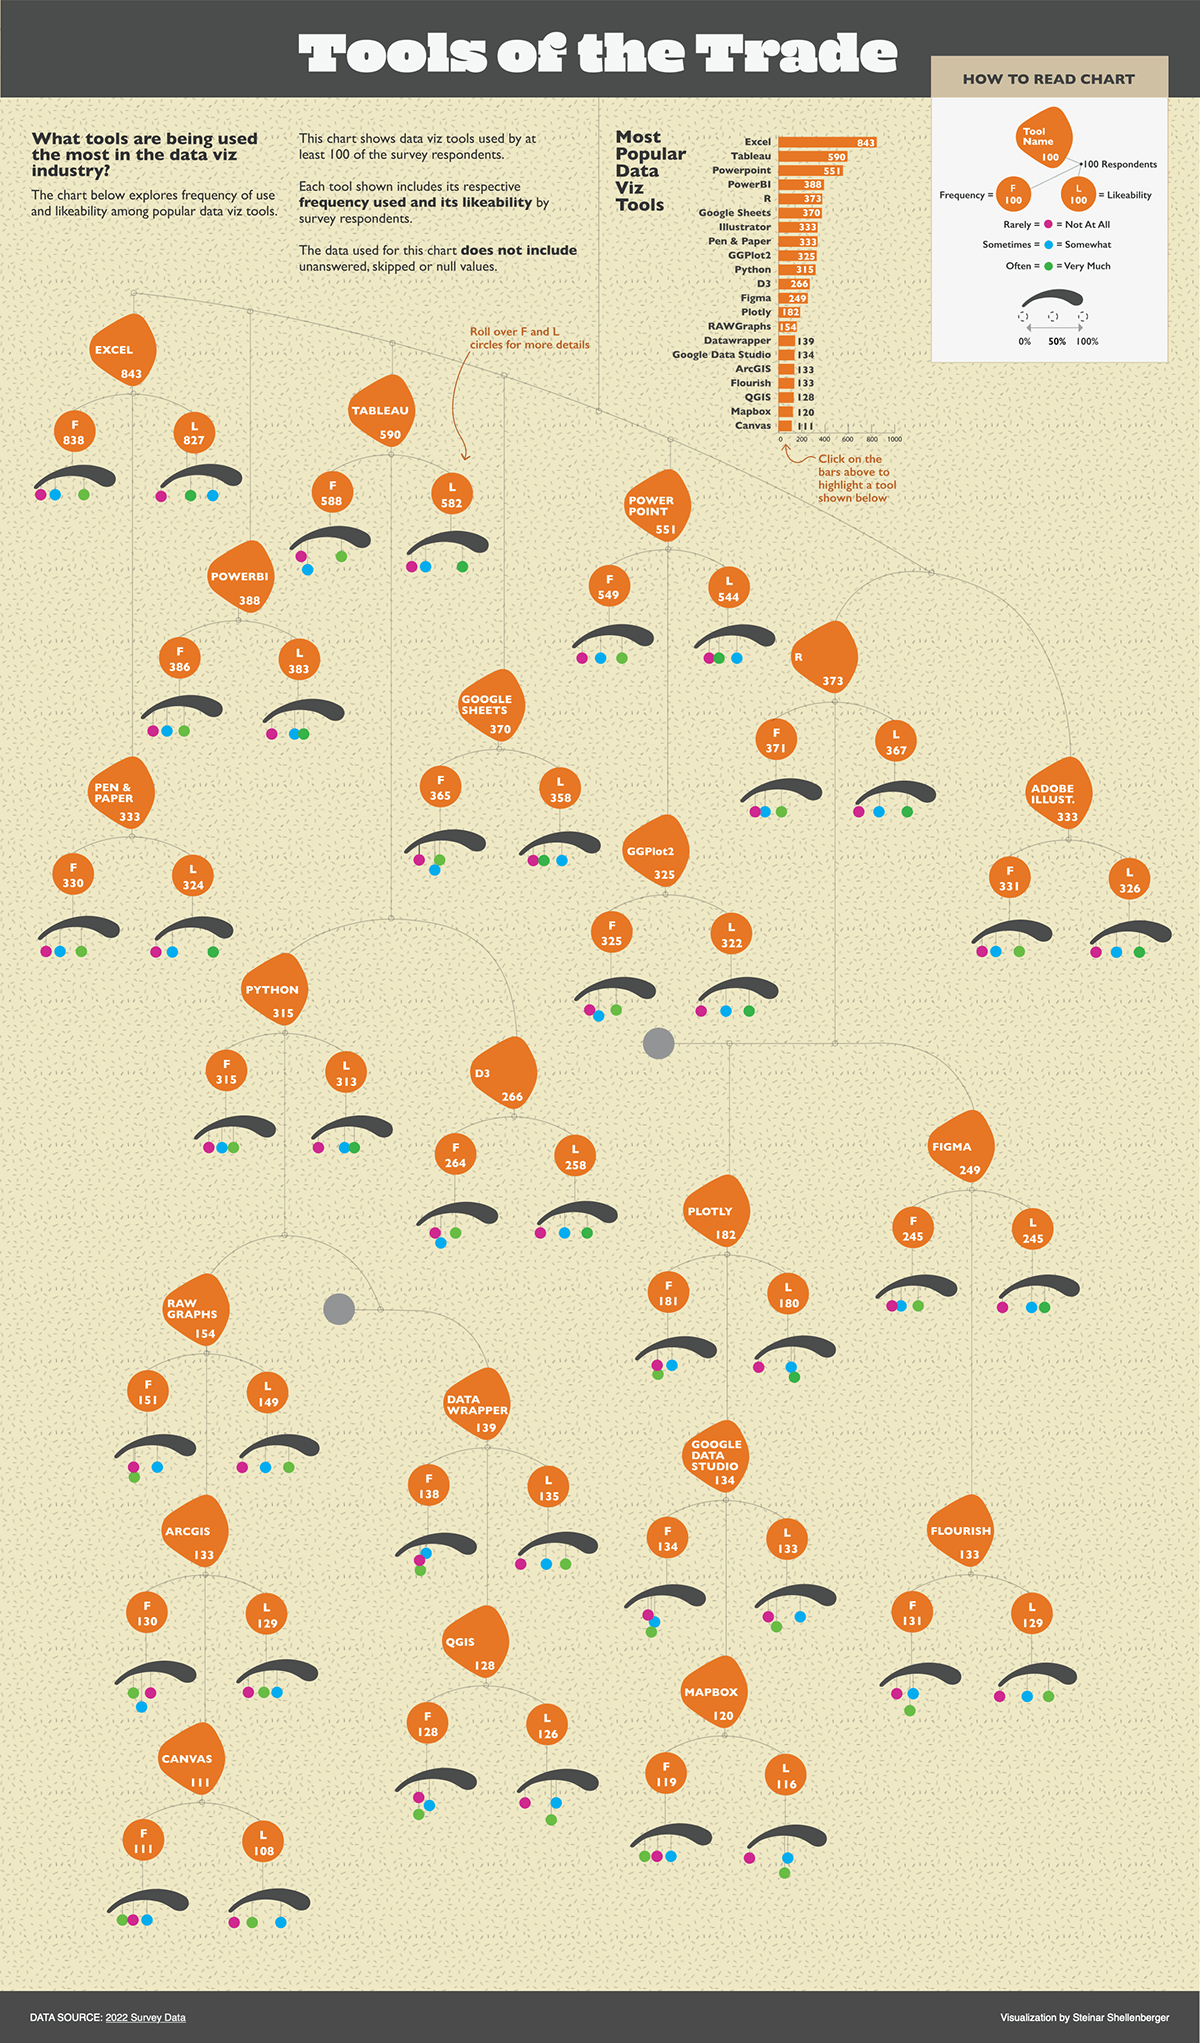
Each of the tools shown in the chart includes its respective frequency of use as well as its likeability by the survey respondents.
The bar chart at the top gives a quick view into which data viz tools are the most popular. Clicking on any of the bars highlights the respective tool in the mobile.
From the data, I focused on tools used by at least 100 of the respondents and I didn't include null values, unanswered or skipped questions.